Related Posts: Utah Polygamy and Divorce – 1880 to 1930; Polygamy versus Democracy; Edmunds Act (1882); Edmunds-Tucker Act (1887); Idaho Test Oath; Marriage in 1890 Utah: Very Normal
Summary: I said this post would be interesting. And it is. The LDS Church officially abandoned polygamy in 1890 due to intense government pressure. The 1890 Census Report contains detailed information on divorce that I believe captures evidence of polygamy in Utah. My previous post analyzed the marriage data (Marriage in 1890 Utah: Very Normal).
Firstly, when talking about divorce in 1890 we are dealing with a very small percentage of the population. The median divorce rate for the US was 0.23%. And it turns out that the overall divorce rate in 1890 in Utah is ordinary, right at the third quartile for US states and territories. However, when you look at divorce by age and sex it becomes much more interesting. Above age 34 Utah has the highest or second highest female divorce rate in the US–from 45 on up only Nevada is higher. But this is interesting because Nevada’s total population was 45,761 compared to Utah’s 207,905. Nevada’s male to female ratio was 1.76 and Utah’s was 1.13. Nevada was a much more difficult place for a woman to live and you would expect a higher divorce rate. But Utah?
More can be said. The male divorce rate for Utah qualifies as ordinary (falls between the first and third quartiles) for all age categories. But if you look at the difference between male and female divorce rates by age then Utah really stands out. The national trend is, overall, downward with male divorces eventually exceeding female divorces. The Utah trend is starkly upward, increasing in nearly a straight line from age 15 to 64. Overall, the female divorce rate far exceeds the male divorce rate. Not only does the divergence between the Utah male and female divorce rates increase with age, it also diverges from the national trend.
If you plot the female divorce rate vs. the male divorce rate for each age category Utah stands out above age 34. (Above 34 the correlation between male and female divorce rates in the US exceeds 80%.) For example, for the 55-64 age category. If Utah followed national trends its female divorce rate should be about 0.54% based on its corresponding male divorce rate. But it is at 1.8%, about 3.4 times higher than it would be based on national trends.
Naturally, since Utah’s divorce stats clearly stand out there must be something unique about Utah not found in other states and territories. The obvious explanation, which I believe is correct, is polygamy.
Polygamous marriages were not legally recognized and therefore required only a church divorce. And its important to know that the census data is self reported. Individuals categorize themselves as married, single, divorced, or widower. Would a divorced polygamous wife report herself as divorced to the census agent? Maybe, but I can’t say for sure. Would a married man report himself as divorced if he was divorced from one of his polygamous wives? Probably not.
According to the Encyclopedia of Mormonism about 20% to 25% of the adult Mormon population were members of polygamous households (Encyclopedia of Mormonism, Plural Marriage).
I find it fascinating that evidence of polygamy can be detected in the census data. And as far as I know the 1890 census data has never been analyzed in this way before.
As with other census data I have analyzed, I compare the white population of Utah to the white population of the rest of the US.
After some thought I decided to do an additional post on divorce. Maybe two. I try to post once a month (some of these are small research projects) but I can’t promise it will be the next one.
Non-Census Data
First, some non-census data.
An interesting report on divorce was published in 1889 (A Report on Marriage and Divorce in the United States 1867 – 1886) giving detailed divorce numbers from 1867 to 1886. The data includes only legal divorces. That is, divorces from legal marriages. It does not capture evidence of polygamy but is none-the-less interesting. This report does not distinguish between parentage or race.
The report categorizes reasons for divorce as follows: Adultery, Cruelty, Desertion, Drunkenness, Neglect to Provide, Combinations of the Preceding, and All Others. The (divorces granted to women)/(divorces granted to men) ratio for each case is shown in Figure 1. This comprises the total number of divorces from 1867 to 1886. Utah is shown in red. In the US divorces were granted to women at about 2 times the rate they were granted to men. In Utah divorces were granted to women at about 1.2 times the rate of those granted to men.
 |
| Figure 1: Divorces granted to women/divorces granted to men by cause. Utah is marked in red. |
[color-box]Note: The Neglect to Provide category is omitted because no men in the US filed for divorced based on this cause.[/color-box]
The divorce rate for US states and territories for 1870 to 1886 is shown in Figure 2 below. (I have included only 1870-1886 due to data constraints and I have omitted the Utah data from 1874 to 1878 due to data corruption. See note at end of post for explanation.) The report also indicates that the average duration of marriage before divorce was 27.52 years for Utah and 26.95 years for the US.
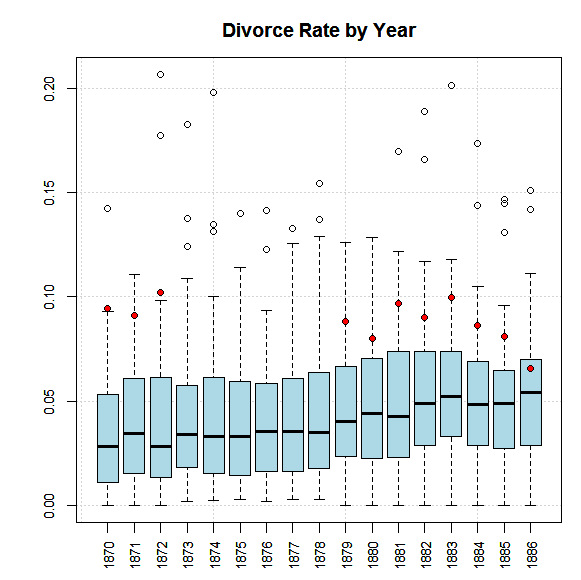 |
| Figure 2: Divorce rate by year. Utah is marked in red. |
Except for 1886 the Utah divorce rate is high but not the highest in the country. 1886 qualifies as ordinary. Also, Utah shows a small decreasing trend whereas the rest of the country generally shows a slight increasing trend.
Census Data
Now for the census data. As mentioned, the white population of Utah is compared to the white population of the other states and territories.
Figure 3a below shows the divorce rate for US states and territories. Notice that Utah is right at Q3 when compared to rest of the US and right at Q1 when compared to the western division (Arizona, California, Colorado, Idaho, Montana, Nevada, New Mexico, Oregon, Washington, Wyoming). This qualifies as ordinary, that is, between or equal to the first and third quartiles. However, the data becomes more interesting when we look at divorce rate by age and sex.
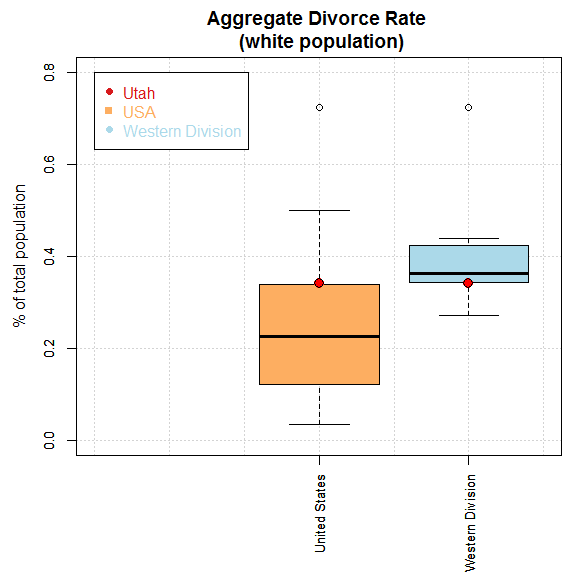 |
| Figure 3a: The divorce rate for US states and territories and for the western division. |
Divorce by Age and Sex
Figure 3b below shows the divorce rates by age and sex, calculated by Equation 1 below. The age categories are 15-19; 20-24; 25-29; 30-34; 35-44; 45-54; 55-64; and 65 up. Divorces for under 15 were omitted since there were few to none in the US. The Utah female divorce rate is shown in red. The Utah male divorce rate is indicated by the light blue squares. The Nevada female divorce rate is shown in gray.
Notice that from 20-24 up to 45-54 the gap between the US medians is fairly constant, and above that the percent male divorces exceed percent female divorces, increasing slightly for 65 up. Note that the male Utah divorce rates qualify as ordinary for all age categories but the female divorce rate increases with age up to 65. Notice how the gap in the Utah female and male divorce rates increase with age up to 65.
This gap is illustrated more clearly in Figure 4a. This data was obtained from Equation 2 and illustrates the divergence shown in Figure 3b.
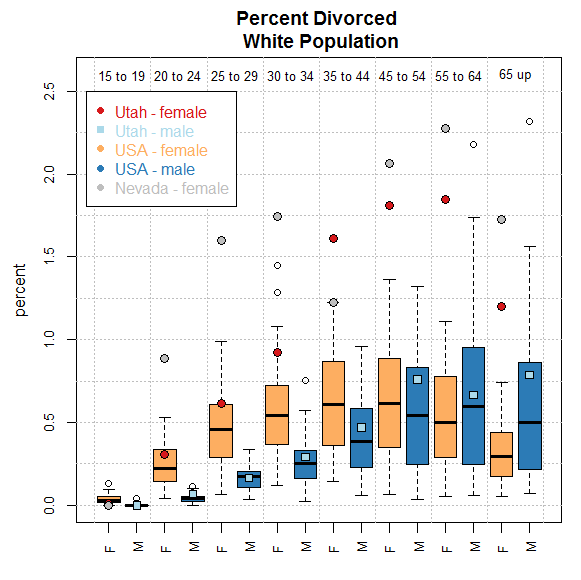 |
| Figure 3b: Divorce rate by age and sex. |
[color-box]
The data for each age category in Figure 3b was calculated using the following equation:
Equation 1:
100* (number of [gender] divorces in age group) / (total population of [gender] age group).[/color-box]
[color-box]
The data for each age category in Figure 4a was calculated using the following equation:
Equation 2:
100⋅( dfa– dma) / (tfa + tma),
where dfa is the total number of divorced females in an age category, dma is the total number of divorced males in an age category, tfa is the total number of females in an age category, and tma is the total number of males in an age category.[/color-box]
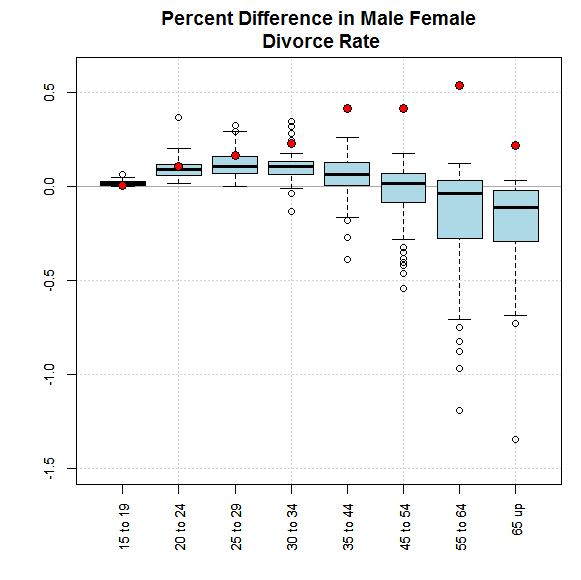 |
| Figure 4a: Percent difference in divorce between males and females calculated from Equation 2. Utah in red. |
Shown in Figure 4a above, the Utah divorce rate gap increases linearly with age from 15 on up to 64, with a small bump at the 35-44 category. Also notice the increasing divergence between the US and Utah that increases with age. From ages 25-29 the US gap trends down, the difference eventually becoming negative when male divorces outnumber female divorces. The Utah trend goes in the opposite direction, only decreasing at 65 up.
Below, Figure 4b shows the same information as Figure 4a but for the western division.
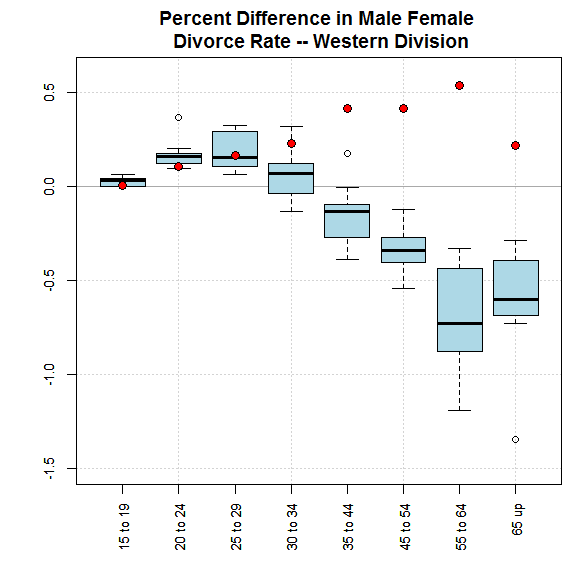 |
| Figure 4b: Same as Figure 4a but for the western division. Utah in red. |
I will add that this is a fairly robust conclusion. The difference can be calculated one of two ways: by to Equation 2 (above) or Equation 3 (below). Using either equation gives the same overall conclusions. The Utah divorce gap increases with age up to 65 and moves in the opposite direction as the national trend.
[color-box]
Equation 3:
100⋅(dfa)/(tfa) – 100⋅(dma)/(tma),
where the factors are the same as for Equation 2.[/color-box]
Two Factor Plots
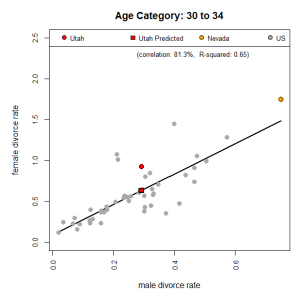
The data can be looked at in another way. Naturally, there is a correlation between the male and the female divorce rates — more divorced males means more divorced females. Above age 30 the correlations exceed 80%. So we can dig a little deeper by looking at some two variable plots.
The five plots below show the percent female divorce rate plotted against the percent male divorce rate for US states and territories. The correlations are included on the plots. The black line shows a linear fit to the state and territory data (excluding Utah). Nevada is marked in orange, for reference. Utah is indicated by a red circle. The red square indicates where Utah’s female divorce rate should be based on its corresponding male divorce rate.
For the 30-34 category Utah is not unusual, see Figure 5. But above age 34 Utah is significantly higher than where it should be based on its the corresponding male divorce rate. Above age 34 Utah’s female divorce rate is 2.1 to 3.4 times higher than where it should be, see Figures 6-9.
What we learn from this is that even though Nevada generally has a higher female divorce rate than Utah, Utah still stands far out from the national trend.
The figures below below were generated by using Equation 1 for females plotted against Equation 1 for males.
 |
|
| Figure 5: female divorce rate vs. male divorce rate, ages 30-34. |
 |
| Figure 6: female divorce rate vs. male divorce rate, ages 35-44. |
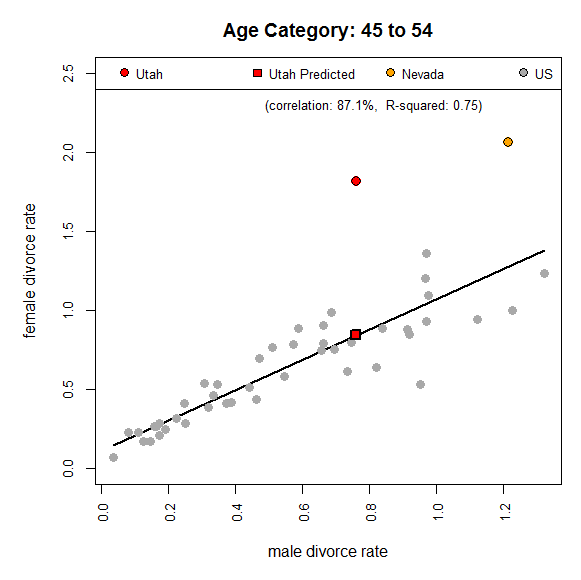 |
| Figure 7: female divorce rate vs. male divorce rate, ages 45-54. |
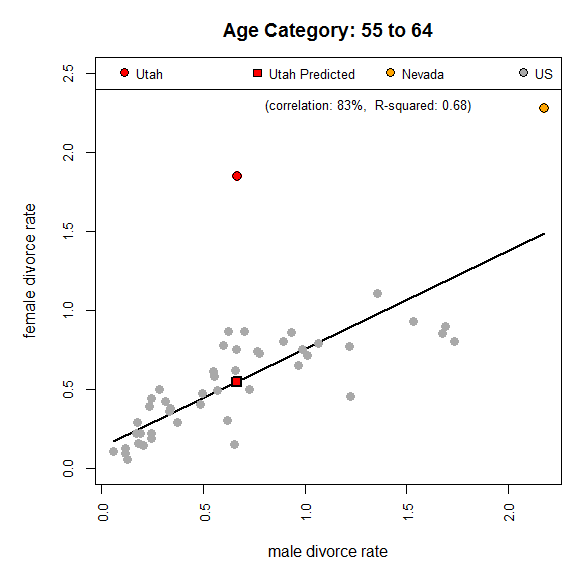 |
| Figure 8: female divorce rate vs. male divorce rate, ages 55-64. |
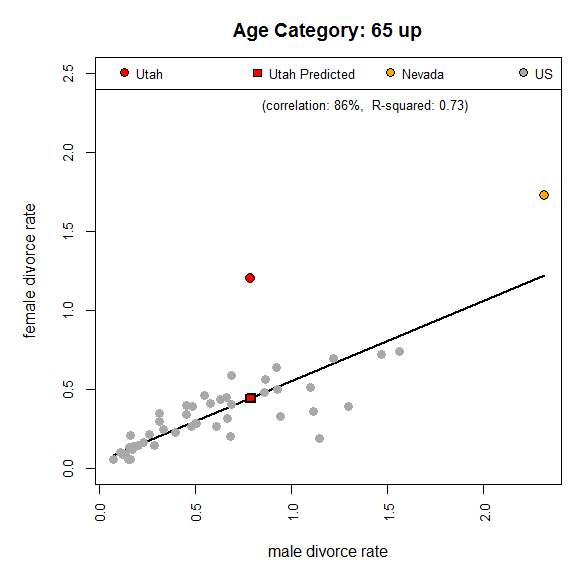 |
| Figure 9: female divorce rate vs. male divorce rate, ages 65 up. |
Conclusions
The total divorce rate for Utah does not stand out. Its value is equal to Q3 when compared to the other states and territories. It’s only when you look at the data by age and sex does Utah stand out, and significantly so.
The most reasonable explanation for this is polygamy. I’m sure polygamy was very difficult for women to live in. And given that the LDS Church allowed women to divorce their husbands, especially if they were unable to live in polygamy, it makes sense that the female divorce rate in Utah would stand out.
Because the census data is self reported we can’t be sure if the divorced women were divorced first wives or divorced polygamous wives. But either way, Utah does stand out.
___________________________________
Note: I had to interpolate the yearly populations for the state and territories from the 1870, 1880, and 1890 Census Reports. The populations were interpolated using a cubic spline. Data earlier than 1870 is omitted due to the territories and states in the western half of the country not being defined. I also combined North Dakota and South Dakota for 1890 into one data point because the divorce data from the report lists only the Dakota Territory. Also, Oklahoma was not included in the original divorce data.
The Utah data from 1874 thru 1878 is omitted due to data corruption. Apparently, Utah law did not require persons to have been an actual Utah resident to file for divorce. A formal statement of intent to reside in the territory was sufficient. Also, the provisions allowing for divorce were liberal. If it could be “made to appear to the satisfaction and conviction of the court that the parties cannot live together in peace and union, and that their welfare and happiness require a separation” then a divorce could be granted. This led to wide abuse by New York and Chicago lawyers. Apparently, out of 691 cases in one Utah county 600 were from outside Utah. Several probate courts in Utah became “bureaus of divorce” for people outside of Utah seeking a divorce. The law was changed in 1878 to close this loophole. See A Report on Marriage and Divorce in the United States 1867 – 1886, pp. 203-306 for a more detailed discussion.
The divorce numbers for Utah for the period 1873-1879 are given below.
Year: 1873 1874 1875 1876 1877 1878 1879
Divorce numbers: 134 149 295 709 914 298 122
According to the author of the report the divorce data is very complete. Out of 2,627 counties 2,496 reported. That is a reporting rate of 95 percent by county and covers about 98 percent of the US population. See pp. 129-130 for discussion.