Related Posts: Divorce in 1890 Utah: Signs of Polygamy; Polygamy versus Democracy; Edmunds Act (1882); Edmunds-Tucker Act (1887); Idaho Test Oath; Marriage in 1890 Utah: Very Normal
Summary: I promised another post on divorce and I finally have enough data to write about. So here it is. (This just keeps getting more and more interesting.)
I have analyzed census data from 1880, 1890, 1900, 1910, 1920, and 1930. I restricted the analysis to the white, 15 and older population for the states and territories of the lower 48 states.
In 1880 Utah’s female divorce rate was the third highest in the US, only New Mexico and Nevada are higher. From 1880 to about 1910 Utah’s female divorce rate steadily decreases while the rest of the US tends to increase. From 1910 to 1930 Utah’s female divorce rate rapidly increases, following the national trend. The male divorce rate from 1890 to 1930 follows the national trend.
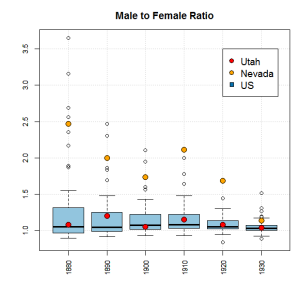
When looking at the difference in percent male and percent female divorce rates we see that in 1880 Utah had the second highest difference in the US, only Nevada is higher. Utah’s over 15 male to female ratio in 1880 was about 1.1 while Nevada’s was almost 2.5. Utah had a population of 143,964 compared to Nevada’s 62,266. From 1890 and 1900 Utah had the highest difference in male and female divorce rates in the United States. By 1910 Utah’s male and female divorce rate difference was the second only to Colorado. By 1920 Utah had the second highest divorce rate difference, only California was higher. By 1930 the difference in Utah’s male-female divorce rate was equal to the US third quartile.
Because the male and female divorce rates for US states and territories are correlated better than 89% two factor plots provide some additional insight. When the female divorce rate is plotted against the male divorce rate Utah stands out from the national trend for 1880, 1890, and 1900. For 1910 and 1920 it stands out a little. By 1930 Utah is well within national trends.
The only explanation I can see for this is polygamy. It appears that polygamy increased Utah’s female divorce rate noticeably above national trends. And this effect lasted for 20 years after the Church of Jesus Christ of Latter-day Saints officially stopped polygamy in 1890, maybe longer.
The value of this goes beyond academic interest. It can also relate to the gay marriage debate currently going on in the US Supreme Court. If the state can ban polyamorous unions then why not same sex marriage. From this data we can see quite objectively that polygamy increases the female divorce rate. I’m not going to get into that debate now but you can hear the supreme court arguments here and here.
Introduction
I have compared the male and female divorce rates from Utah to the corresponding divorce rates from the lower 48 states and territories of the US. I have compiled data for 1880, 1890, 1900, 1910, 1920, and 1930. The data for 1890, 1900, 1910, 1920, and 1930 are from the census reports (which I keyed in by hand). For 1880 I was able to access a complete count data set from IPUMS-USA (University of Minnesota, www.ipums.org).
As with other posts that I have published using census data I compare only the white population of Utah to the white population of the other US states and territories.
As the introduction points out, Utah’s female divorce rate stands out from national trends. It’s difficult to say if this is due to men divorcing their wives to marry younger girls, or if women who were tired of polygamy were divorcing their husbands. To me it seems more likely that wives were divorcing their husbands. My earlier post (Divorce in 1890 Utah: Signs of Polygamy) showed that on average legal divorces in Utah were granted to women at about 1.2 times the rate they were granted to men. For the US women were granted divorces at about 2 twice the rate they were granted to men.
The fact that a man could marry a younger wife without divorcing his current wife leads me to belief that wives were divorcing their husbands. I can’t say for sure if Utah’s elevated female divorce rate is due to polygamous wives divorcing their husbands, or first wives divorcing their polygamous husbands, or husbands divorcing their wives, but whichever way, the best explanation by far for Utah’s elevated female divorce rate is polygamy.
Keep in mind that the census data is self reported. That is, women and men reported themselves as married, widowed, divorced, or single. So a polygamous husband who was divorced from one of his wives probably would not report himself as divorced. But a polygamous wife who was currently divorced from her husband might report herself as divorced.
Also note that when I say a data point is “ordinary” I mean it falls between Q1 and Q3, which is the middle 50% of the data set. That is, it falls within the box-part of a box-plot.
It should also be pointed out that during this period of history the overall divorce numbers were low. See Table below for Utah. But because the census data is a complete count these numbers are accurate and do reflect the total number of divorced persons in each state and territory.
[table id=1 /]
Let’s begin with the male and female divorce rates shown in Figure 1. Notice that for Utah the male divorce rate qualifies as ordinary for each year and follows the national trend. However, from 1880 to 1910 Utah’s female divorce rate starts high and slowly decreases, going in the opposite direction as the national trend. Notice that in 1910 it nearly qualifies as ordinary. From 1910 to 1930 Utah’s female divorce rate increases rapidly following the national trend. Utah’s female divorce rate in 1920 it is a bit high but by 1930 it qualifies as ordinary.

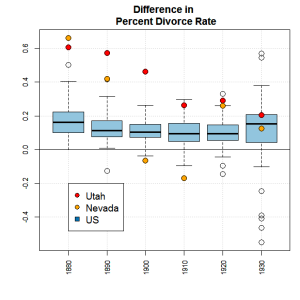
Figure 2 shows the difference in male and female divorce rates, derived from Equation 1. This figure shows that from 1880 to 1920 Utah had the highest or second highest difference in divorce rate in the US. For 1880 and 1920 only Nevada and Colorado are higher, respectively. For 1880 Nevada’s male to female ratio was almost 2.5 while Utah’s was about 1.1, which could explain why Nevada is so much higher than the rest of the country, but Utah’s divorce rate difference is almost as high. In 1920 Colorado’s divorce rate difference was nearly the same as Utah’s and both are much closer to ordinary.
[color-box]
Equation 1: 100*( df/fp – dm/mp),
where df is the divorced white female population ages 15 and up, fp is the total white female population ages 15 and up, dm is the divorced white male population ages 15 and up, and tm is the total white male population ages 15 and up.[/color-box]
We can also look at the divorce differences as a percent, from Equation 2. This is the total number of divorced females minus the total number of divorced males divided by the over 15 population. This is shown in Figure 3.
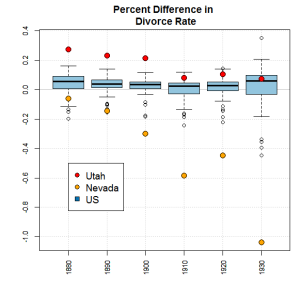
From Figure 3 we see that Utah has the highest percent difference between male and female divorces for 1880, 1890, and 1900. For 1910, 1920, and 19340 Utah is no longer an outlier.
[color-box]
Equation 2: 100*[ (df – dm)/( fp + mp),
where the factors are the same as defined in Equation 1.[/color-box]
Two factor plots
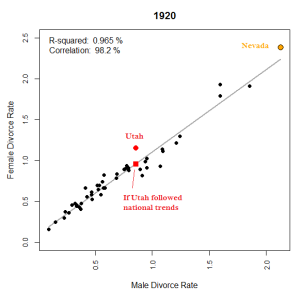
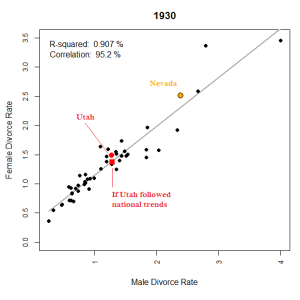
It turns out that the male divorce rate is a good predictor of the female divorce rate. The correlation between the two is better than 89% for each decade. So we can get some insight from two factor plots showing the female divorce rate plotted against the male divorce rate for each state and territory. That is 100*df/fp is plotted against 100*dm/mp. This is done for each decade from 1880 to 1930.
Each plot includes a regression line which I refer to as the national trend line. This is obtained by regressing the female divorce rate on the male divorce rate for US states and territories, Utah excluded. For example, if state’s male divorce rate is low but it follows the national trend then its corresponding female divorce rate should be near the regression line.
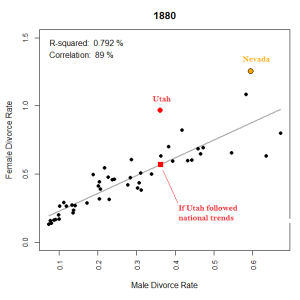
Recall from Figure 1 that Utah’s male divorce rate qualifies as ordinary for each census year. So for 1880 if Utah followed the national trend line its female divorce rate would be around 0.57%, but it is closer to 1%. Utah’s female divorce rate is about 69% higher than the national trend line.
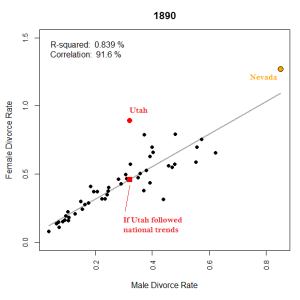
A similar effect is found in 1890, Figure 5. If Utah’s female divorce rate followed national trends it should be 0.46%, but it is 0.89%. Utah is 89% higher than the national trend line.
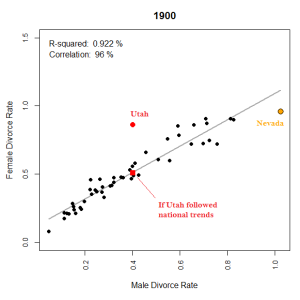
This is true again for 1900. If Utah’s female divorce rate followed the national trend it would be 0.51%, but it is 0.86%. Utah is 68% higher than the national trend line.
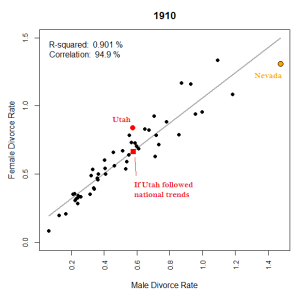
By 1910 Utah is much closer to the national trend line. It looks like it could fall within the natural variability. The same is true for 1920 and 1930. For 1910 Utah is only 25% higher than the national trend line. For 1920 and 1930 it is 20% and 7.7% higher than the national trend line, respectively.
Conclusions
If in 1930 Utah was well within the national trend and qualifies as ordinary, then why does it stand out in earlier decades? It seems that Utah could qualify as ordinary but for some census years does not.
If Utah stands out than there must be something about Utah that causes this, and is not found in the other states and territories. As I already pointed out, polygamy is the best explanation.
Just for interest
Just for interest the male to female ratios for the US are shown in Figure 10.
Note about 1880 data
IPUMS-USA makes the full count 1880 census data set available. I downloaded just over 50 million census records containing data on race, age, sex, resident state or territory, and conjugal condition. I extracted the records of interest. The data is made available through a collaboration between the Minnesota Population Center and the Church of Latter-Day Saints.
Typo
On the two-factor plots I show R-Squared as a percent. This is an error. Just ignore the percent sign. I’ll get to fixing it later.