Related Posts: Education Funding in early Utah, 1870-1899
The problem
This post provides supplemental data for my research into early Utah education, 1870-1899. In it I explain how I made the age corrections to the legal school-age population for each state.
See the age corrections for every state at my web-page: http://www.troysrepublic.com/AgeCorrections.html
For eduction statistics, many statistics of interest are ratios of the school age population. However, it wasn’t until 1890 that the Reports to the Commissioner of Education (COE reports) reported the 5 to 18 population for each state and territory. In prior reports the school-age population was enumerated according to the legal school age for each state or territory. It could be 4 to 16, 5 to 21, 6 to 16, etc. Also, most of the age ranges are not inclusive, so 5 to 18 is really ages 5 up to but not including 18. So when I say, for example, that the legal school age is 5 to 17 what I mean is that the legal school age is 5 through 16. Also, the legal school age could change. For example, in 1875 Alabama’s legal school age was 5 to 21. In 1877 it was 7 to 21.
Source material
On March 2, 1867 the United States Bureau of Education was organized. Their first big report came out in 1870. The yearly reports to the United States Commissioner of Education contain a wealth of education statistics. Prior to this the only available national education statistics were found in the census reports. The census data was taken by census workers who would travel from home to home and gather such information such as the number of persons in the household, who was working, who attended school, how many children were present, and so forth. As far as the COE data is concerned, each state was responsible for reporting its own data, and in each state and territory individual schools were responsible for reporting to their state or territorial school superintendent. Hence the quality of the data for any given year depends on the number of schools that reported. There is also the problem of double counting. If a child was enrolled in a school during the regular school year and then enrolled in a summer school she could be counted twice, thus inflating enrollment and attendance numbers. For New Hampshire, “The law respecting the enumeration of youth of school age is very imperfectly attended to, and the figures as to the number of such children here given are probably much below the truth” (COE Report, 1880).
There is nothing I can do about this except to point it out as a possible source of bias.
The corrections
In order to make comparisons I had to estimate the 5 to 18 population for each state. This required a correction to the reported number of school age children.
From the 1870, ’80, 90, and 1900 Census Reports I took the number of persons for each age for each state and territory. From this data I then interpolated the “in between” years for each age. From those interpolations I estimated the numbers of persons from 5 to 18 for all the in between years as well as the size of the legal school age population for each state. The Census Based 5 to 18 group was then multiplied by a correction factor in such a way that the 5 to 18 populations for the census years of 1870, 1880, and 1890 are exactly reproduced. An example of my procedure follows–I tried several other methods but none of them produced better results.
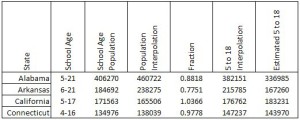
In 1875 the legal school age in California was 5 to 17 and the number of children in that age range was 171,563 according to the 1875 COE report. My 5 to 17 Census interpolation for that year was 165,506 which is about 1.037 times smaller than the COE value. (171564/165506 = 1.037.) My 5 to 18 Census estimate was 176,762. The assumption I made is that the 5 to 18 estimate is off by the same fraction as my school-age interpolation. I assumed my 5 to 18 estimate was 1.037 times smaller than the actual value because my 5 to 17 interpolation was. Applying this correction to my 5 to 18 estimate gives me 176762*1.037 = 183,231 school age children between the ages of 5 and 18 for California. More examples are given below.
Checking the quality of the correction
 It turns out that for 1885, 1886, and 1887 the COE reports list the 6 to 14 population as well as the legal school age population for each state. This permitted me to check the accuracy of my correction technique. So instead of applying a correction to my 5 to 18 Census interpolation I made a correction to a 6 to 14 Census interpolation. I then checked my correction against the reported 6 to 14 populations found in the COE reports.
The percent difference between my 6 to 14 correction and the reported 6 to 14 COE population data is given to the left.
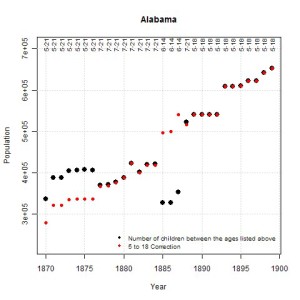
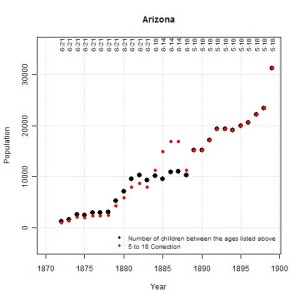
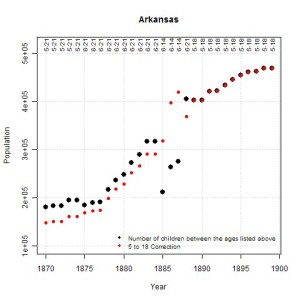
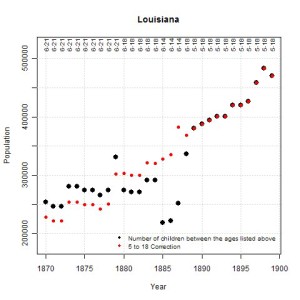
Also, because the COE reports list the 5 to 18 population after 1889 my corrections may be checked for continuity with those latter numbers. Graphs are shown below.Note, for 1885, 1886, and 1887 the numbers are low for each state and territory. For those years I used the 6-14 population in place of the legal school age population, which gave better results for some states and was OK for others.
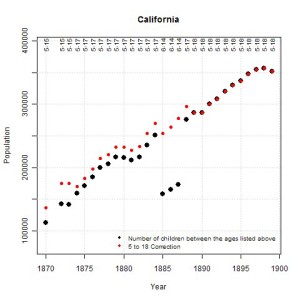
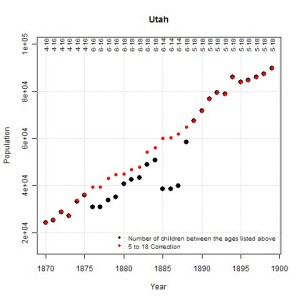
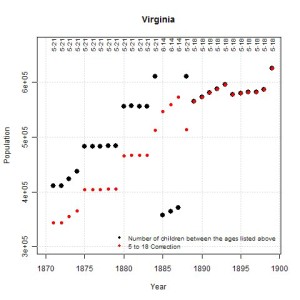
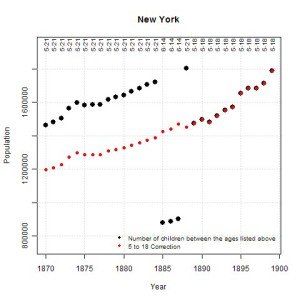
For the graphs below the black dots indicate the number of children of legal school age for that state. The red dot is my corrected 5-18 population estimate. After 1889 these numbers are identical so a red dot is plotted over a larger black dot. Also note the low 1885, 1886, and 1887 black dots. These are the 6-14 ages.
Using the three years of 6-14 data provides an additional continuity check. Typically the 6-14 population is smaller than the legal school-age population and in most cases my 6-14 correction matches up pretty well previous 5-18 corrections. But you can judge the quality of my corrections for yourself.
The Age Corrections
Here are a few of the age corrections
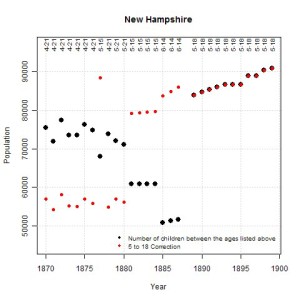
New Hampshire does have its problems. See comment in main text.
